SpringBoot:指标监控
SpringBoot Actuator
简介
未来每一个微服务在云上部署以后,我们都需要对其进行监控、追踪、审计、控制等。SpringBoot就抽取了Actuator场景,使得我们每个微服务快速引用即可获得生产级别的应用监控、审计等功能。
引入依赖
<dependency>
<groupId>org.springframework.boot</groupId>
<artifactId>spring-boot-starter-actuator</artifactId>
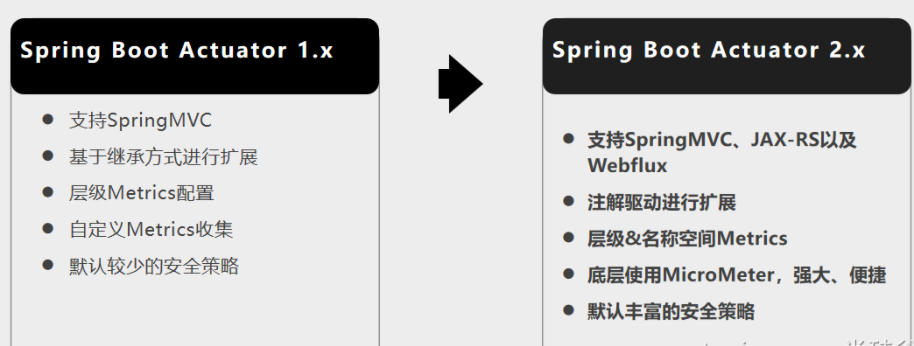
</dependency>1.x与2.x的不同
使用
- 引入场景
- 访问 http://localhost:8080/actuator/**
默认只有health和info是web暴露的,
暴露所有监控信息为HTTP
management:
  endpoints:
    enabled-by-default: true #暴露所有端点信息
    web:
      exposure:
        include: '*'  #以web方式暴露
测试
所有端点及其作用
可视化
https://github.com/codecentric/spring-boot-admin
Actuator Endpoint
最常使用的端点
|
ID |
描述 |
|
|
暴露当前应用程序的审核事件信息。需要一个 |
|
|
显示应用程序中所有Spring Bean的完整列表。 |
|
|
暴露可用的缓存。 |
|
|
显示自动配置的所有条件信息,包括匹配或不匹配的原因。 |
|
|
显示所有 |
|
|
暴露Spring的属性 |
|
|
显示已应用的所有Flyway数据库迁移。 |
|
|
显示应用程序运行状况信息。 |
|
|
显示HTTP跟踪信息(默认情况下,最近100个HTTP请求-响应)。需要一个 |
|
|
显示应用程序信息。 |
|
|
显示Spring |
|
|
显示和修改应用程序中日志的配置。 |
|
|
显示已应用的所有Liquibase数据库迁移。需要一个或多个 |
|
|
显示当前应用程序的“指标”信息。 |
|
|
显示所有 |
|
|
显示应用程序中的计划任务。 |
|
|
允许从Spring Session支持的会话存储中检索和删除用户会话。需要使用Spring Session的基于Servlet的Web应用程序。 |
|
|
使应用程序正常关闭。默认禁用。 |
|
|
显示由 |
|
|
执行线程转储。 |
如果您的应用程序是Web应用程序(Spring MVC,Spring WebFlux或Jersey),则可以使用以下附加端点:
|
ID |
描述 |
|
|
返回 |
|
|
通过HTTP暴露JMX bean(需要引入Jolokia,不适用于WebFlux)。需要引入依赖 |
|
|
返回日志文件的内容(如果已设置 |
|
|
以Prometheus服务器可以抓取的格式公开指标。需要依赖 |
最常用的Endpoint
- Health:监控状况
- Metrics:运行时指标
- Loggers:日志记录
Health Endpoint
健康检查端点,我们一般用于在云平台,平台会定时的检查应用的健康状况,我们就需要Health Endpoint可以为平台返回当前应用的一系列组件健康状况的集合。
重要的几点:
- health endpoint返回的结果,应该是一系列健康检查后的一个汇总报告
- 很多的健康检查默认已经自动配置好了,比如:数据库、redis等
- 可以很容易的添加自定义的健康检查机制
# management.endpoint.端点名.xxxx 对某个端点的具体配置
management:
endpoints:
enabled-by-default: true #暴露所有端点信息
web:
exposure:
include: '*' #以web方式暴露
endpoint:
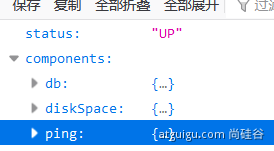
health:
show-details: always这样每个监控状态都显示出来,比如数据库、redis等
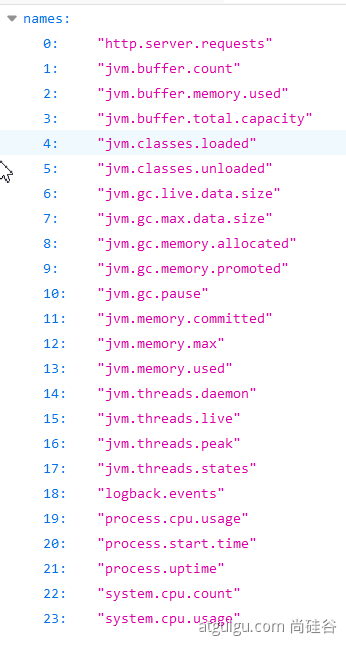
Metrics Endpoint
提供详细的、层级的、空间指标信息,这些信息可以被pull(主动推送)或者push(被动获取)方式得到;
- 通过Metrics对接多种监控系统
- 简化核心Metrics开发
- 添加自定义Metrics或者扩展已有Metrics
管理Endpoints
1、开启与禁用Endpoints
- 默认所有的Endpoint除过shutdown都是开启的。
- 需要开启或者禁用某个Endpoint。配置模式为 management.endpoint.<endpointName>.enabled = true
management:
  endpoint:
    beans:
enabled: true- 或者禁用所有的Endpoint然后手动开启指定的Endpoint
management:
  endpoints:
    enabled-by-default: false
  endpoint:
    beans:
      enabled: true
    health:
      enabled: true
定制 Endpoint